Plotting Points in Four Quadrants: Coordinate Plane Explorer
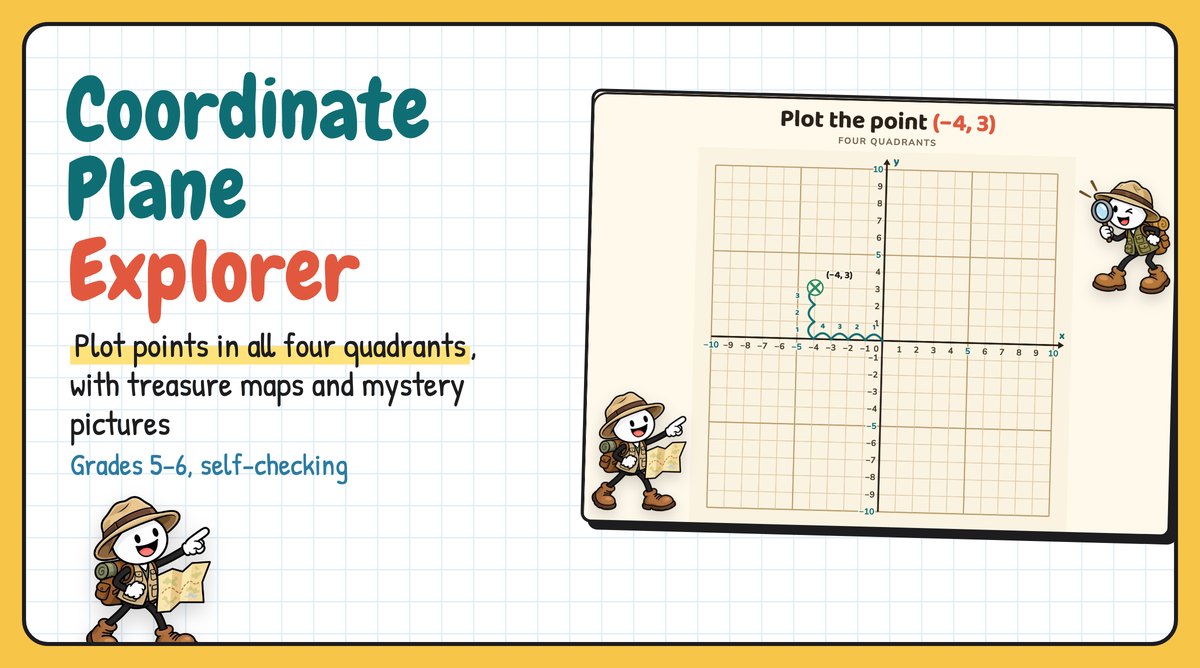
Coordinate Plane Explorer is a digital tool for plotting points on the coordinate plane, from the first quadrant to all four. "Across first, then up or down" is the rule, but students still swap x and y, lose the negative signs, and count from the wrong place.
In this tool, every point has a path. When a student plots a point correctly, numbered hops count the way from the origin. Seven levels go from plotting points to reflections, distances, rectangle area, treasure-map word problems and mystery pictures. An explorer guides students through it, and every answer is checked.
Watch it in action
The tool runs in any web browser. There's nothing to print or set up, and students don't need logins.
A plane that's easy to count
The plane fills the screen, and every line on both axes is numbered, from −10 to 10. The 5s and 10s are in a different colour, so students can count on from them. On a computer, the point under the mouse shows dashed guide lines to both axes, so x and y can be read off the numbers before students tap.
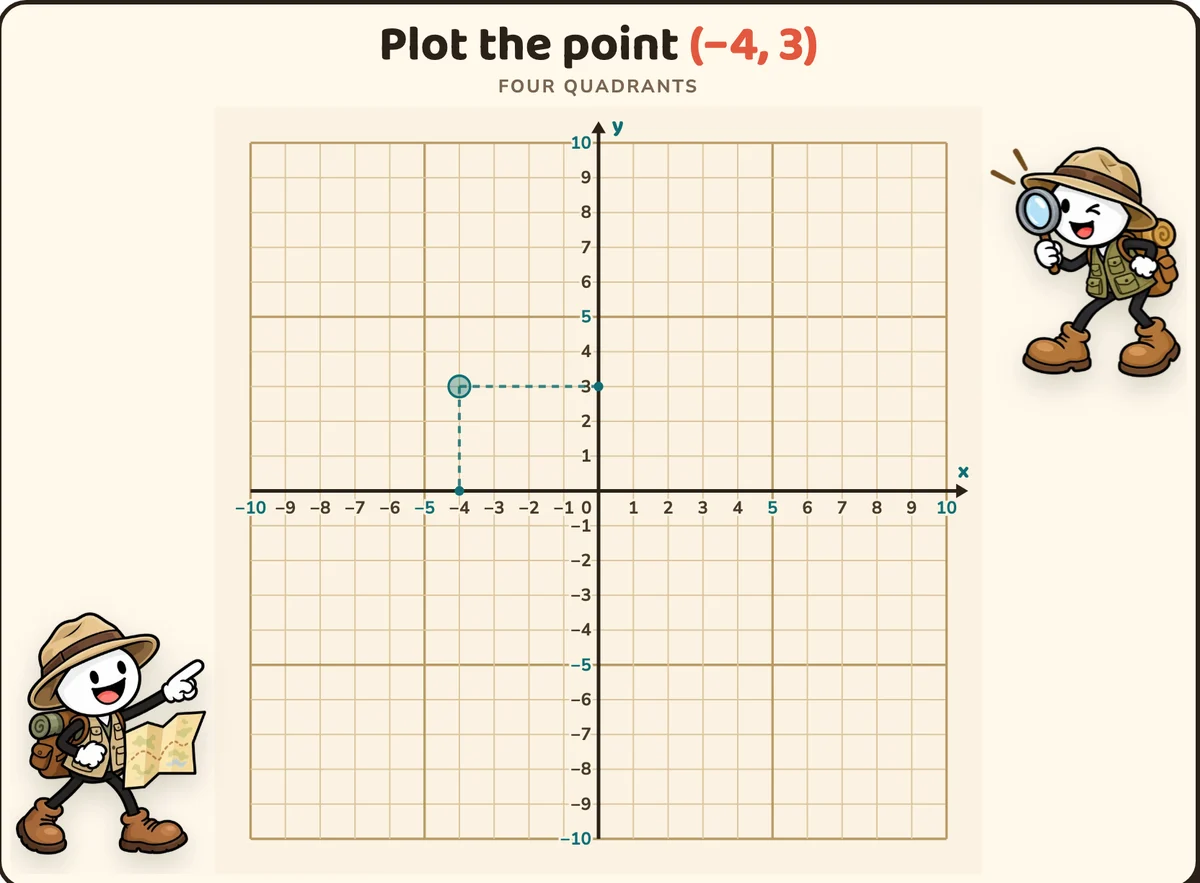
Students tap to put an X, move it if they want, then press Check my point.
Hops that count the way
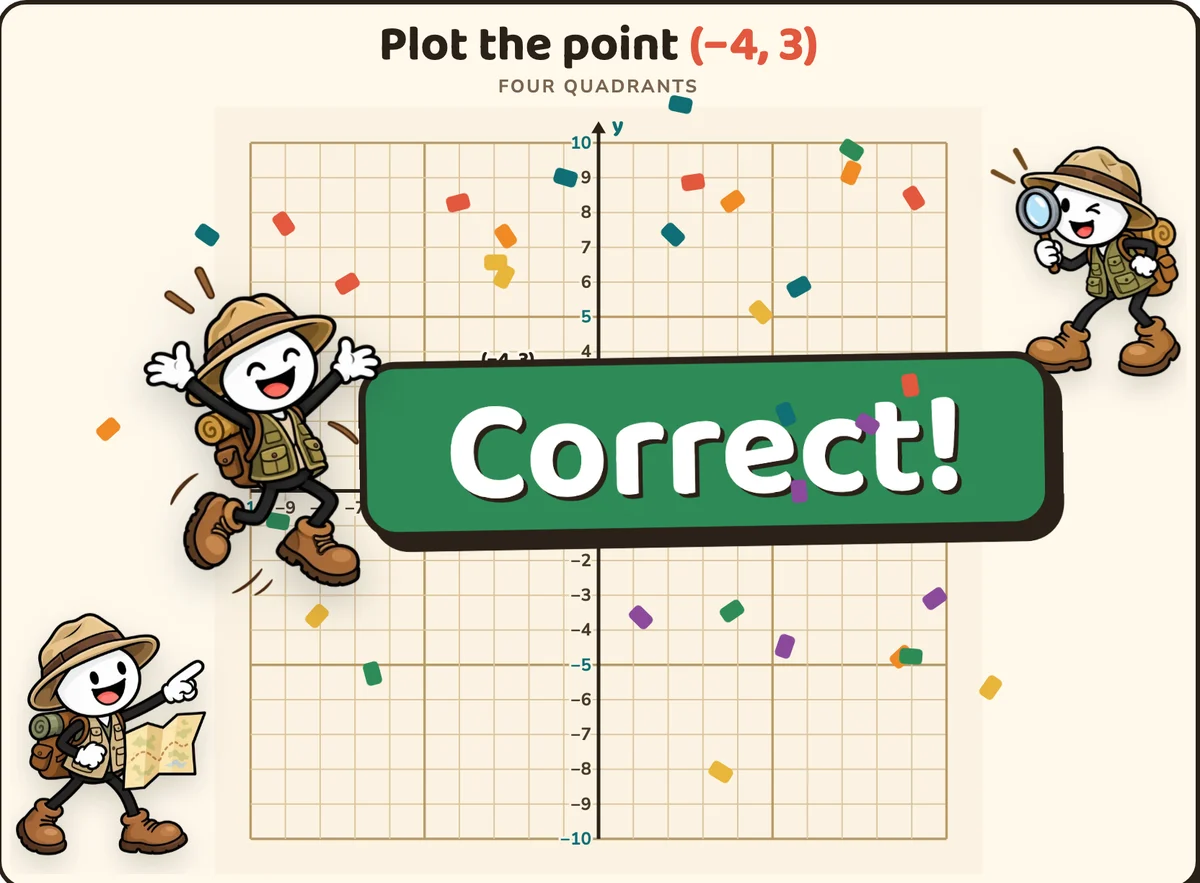
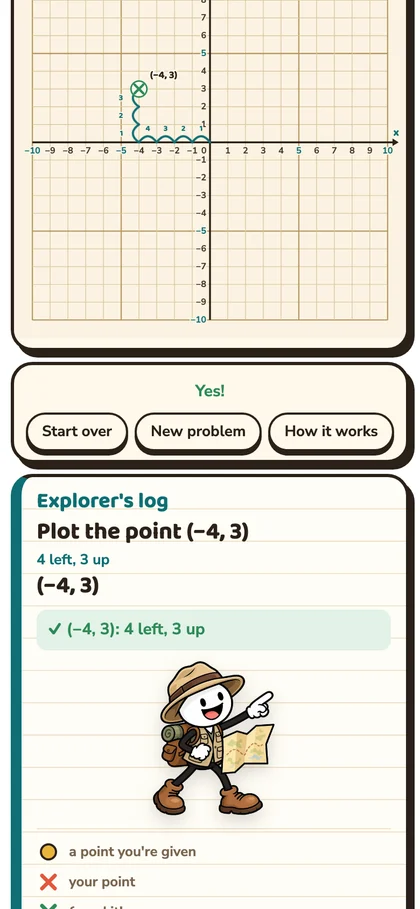
A right answer doesn't just turn green. Numbered hops walk from the origin to the point: 1, 2, 3, 4 to the left, then 1, 2, 3 up. That's (−4, 3) said out loud, as a path.
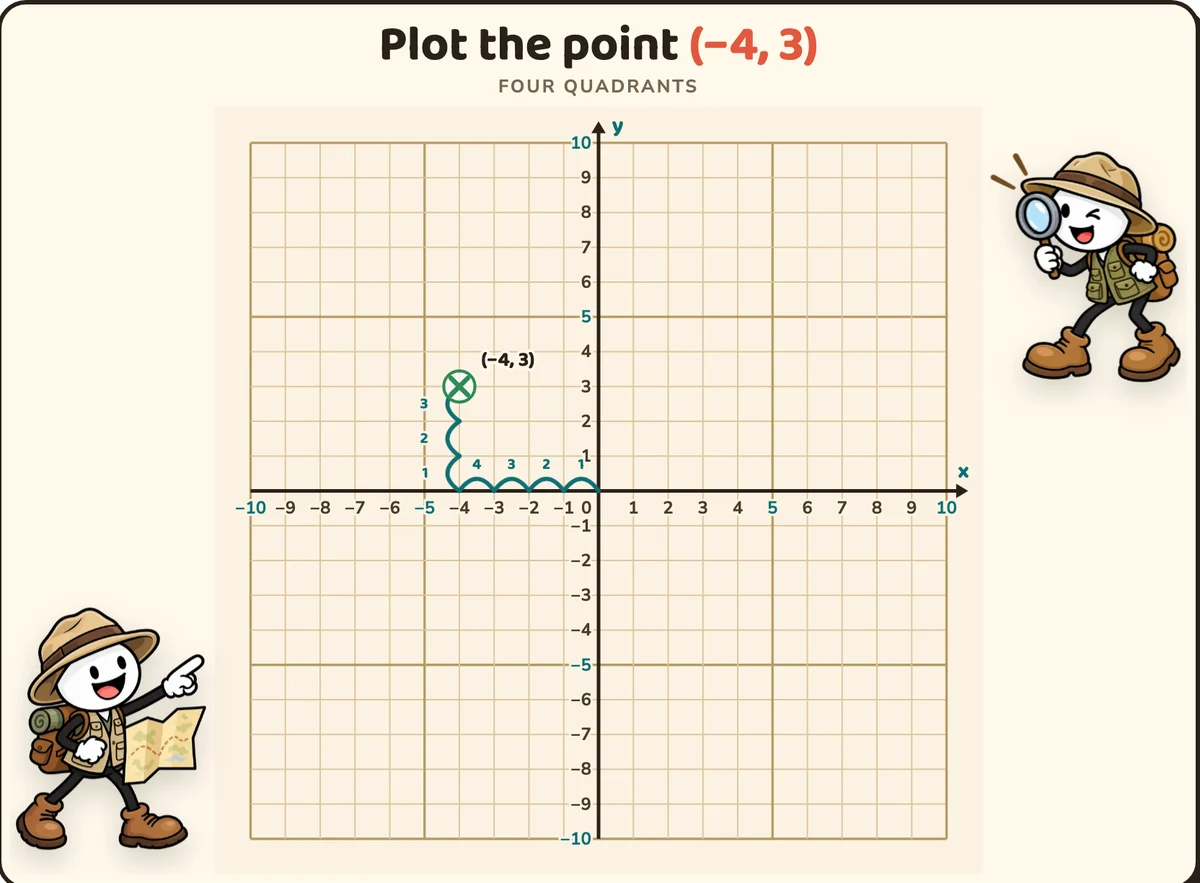
Then the explorer jumps in with a big Correct!, and the Explorer's log writes the check: (−4, 3): 4 left, 3 up.
Hints for the mistakes students really make
A wrong point stays on the plane, with its guide lines, and the hint says what went wrong. A student who plots (3, −4) for (−4, 3) gets "You swapped them. x comes first: go across −4, then up 3."
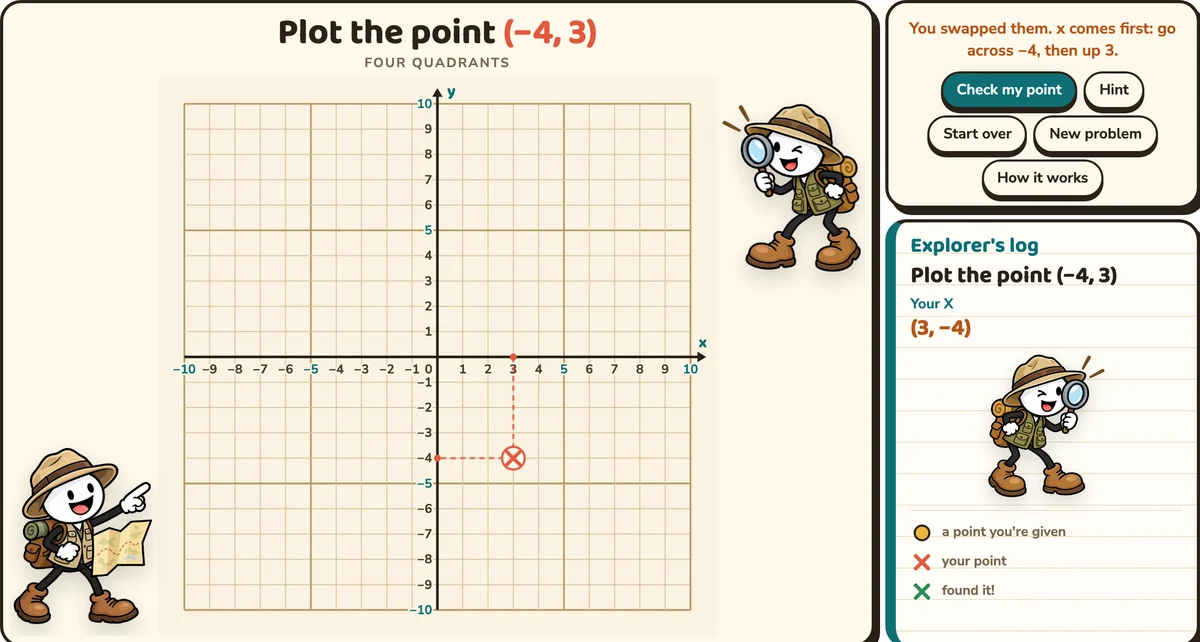
Other hints catch the wrong sign of x or y, reflecting across the wrong axis, subtracting instead of adding across an axis, perimeter instead of area, and starting a walk at the origin instead of the landmark.
How it works, for every level
The first time a level is opened, it starts with a worked example on the plane and a short explanation in the log. In Four quadrants, the quadrants are named with their signs, and the example walks to (−4, 2): 4 left, then 2 up.
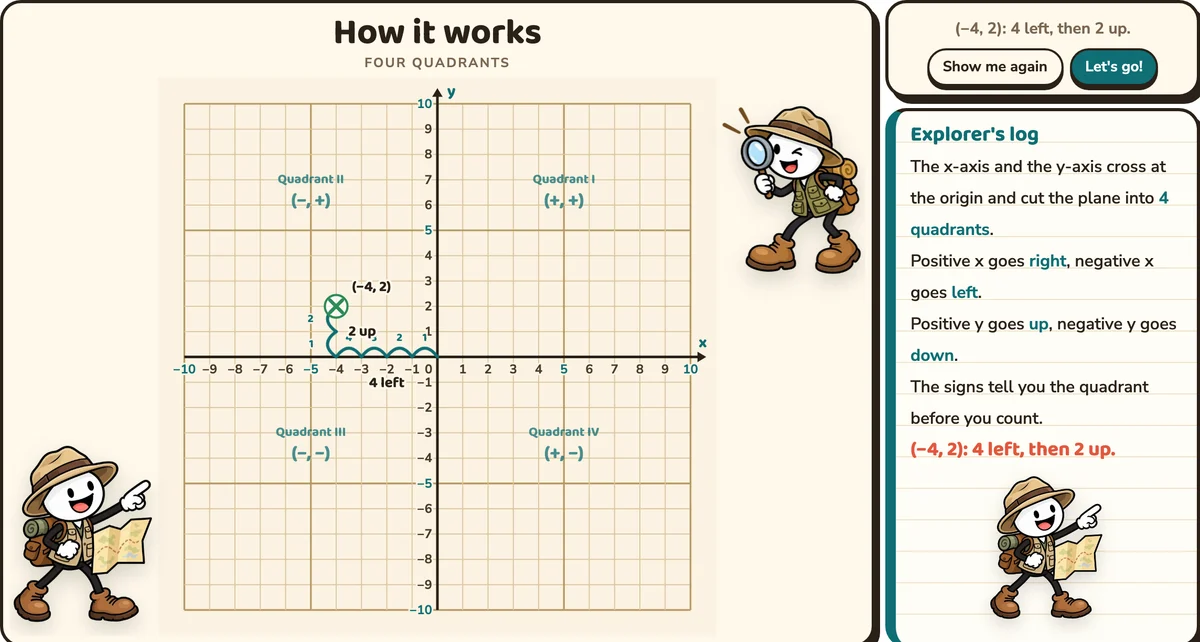
Students tap Let's go! to start. The explanation is always one tap away after that, with the How it works button.
Seven levels
- First quadrant: plot and name points from 0 to 10, like (3, 5)
- Four quadrants: plot and name points with negative coordinates, like (−4, 2)
- Reflect a point: across the x-axis or the y-axis
- Distance: between points in the same row or column, often across an axis
- Rectangles: plot the fourth corner, then find the area
- Treasure map: word problems with north, south, east and west
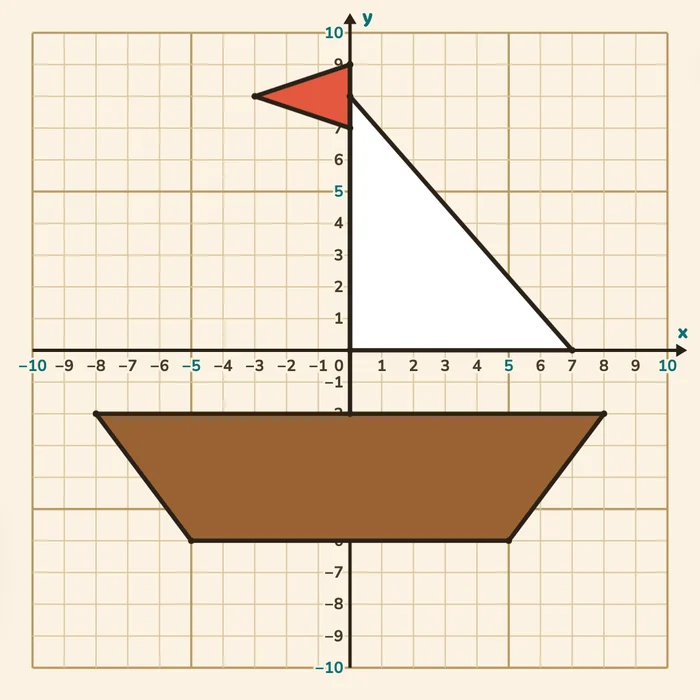
- Mystery picture: plot the points in order to find a picture
Every level makes new problems each time.
Reflect a point
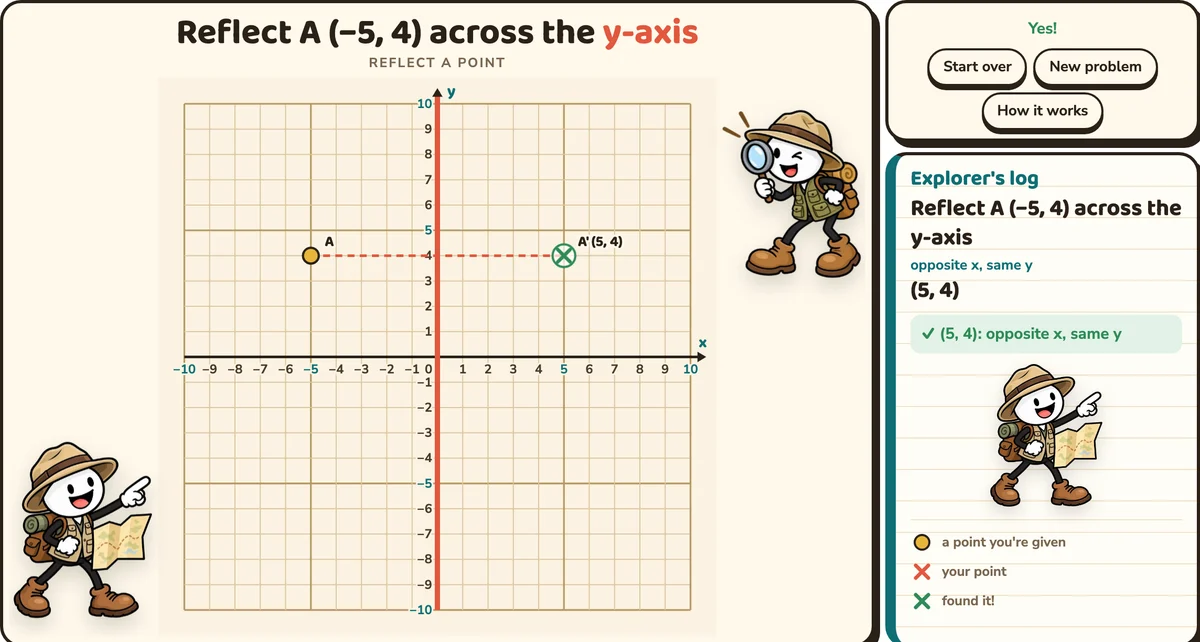
The axis to reflect across glows coral, like a mirror. A at (−5, 4) reflected across the y-axis lands at (5, 4): the same distance from the axis, on the other side. The dashed line shows it.
Distance across an axis
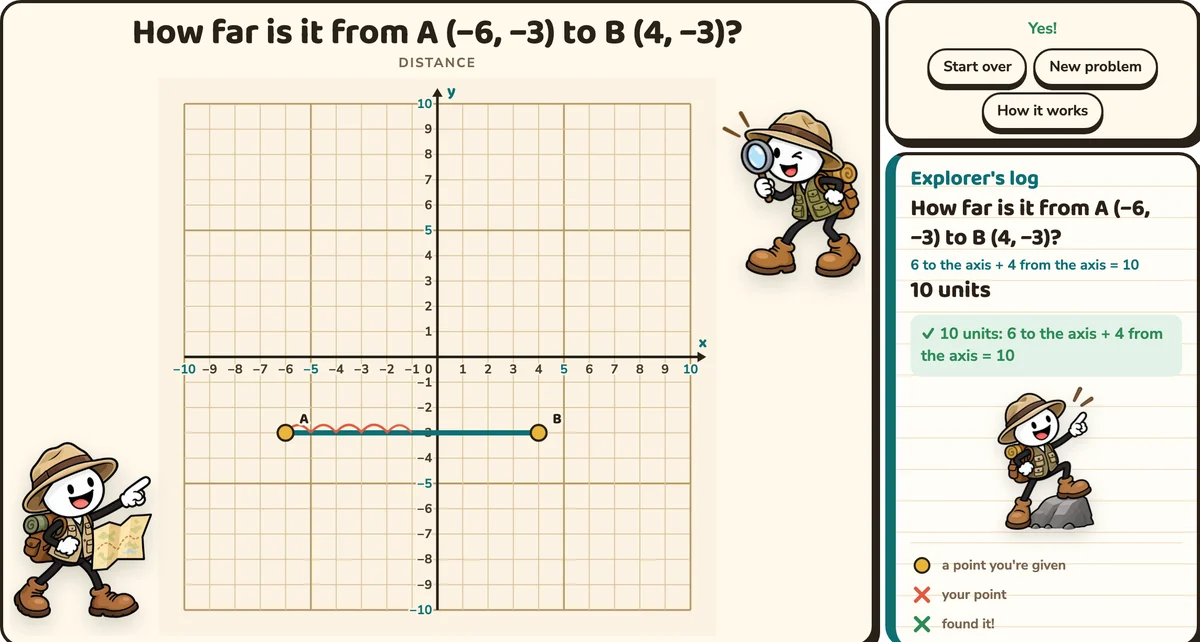
From A (−6, −3) to B (4, −3), the points share a y, so students count along the row. Hop arcs show every unit. A is 6 from the axis and B is 4 from it, so the distance is 10. The answer 2 gets "A and B are on opposite sides of the axis. Add the two distances to the axis."
Rectangles: the fourth corner, then the area
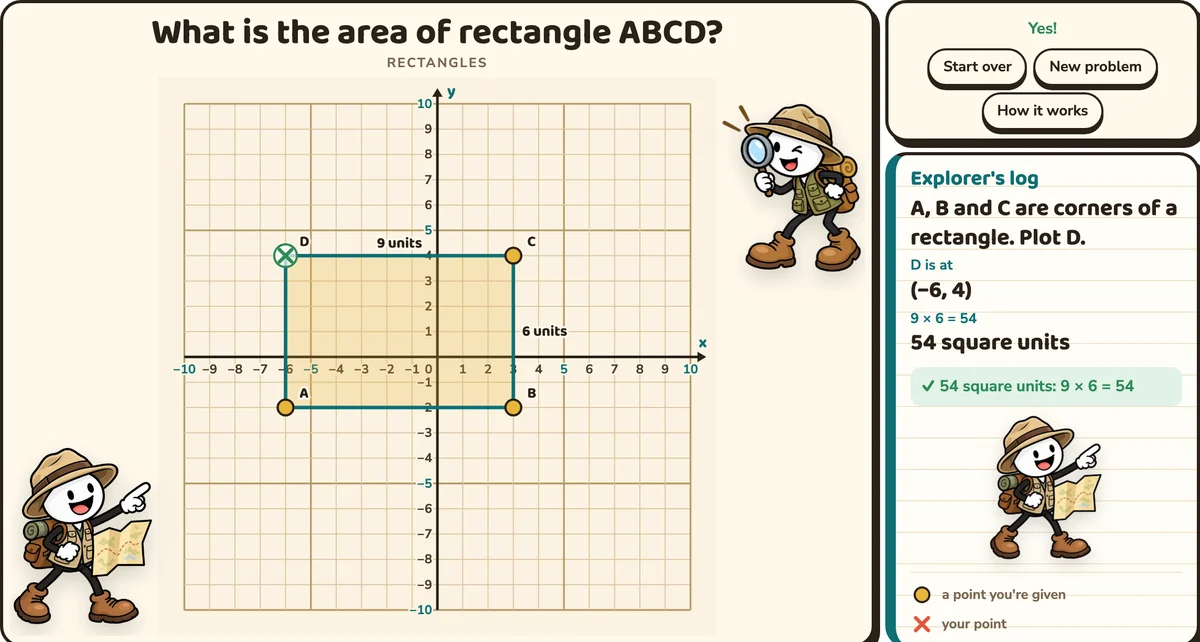
A, B and C are three corners of a rectangle, and students plot D. Each corner shares its x with one neighbour and its y with the other. Then the rectangle is drawn in with its side lengths, and students find the area: 9 × 6 = 54 square units.
Treasure map
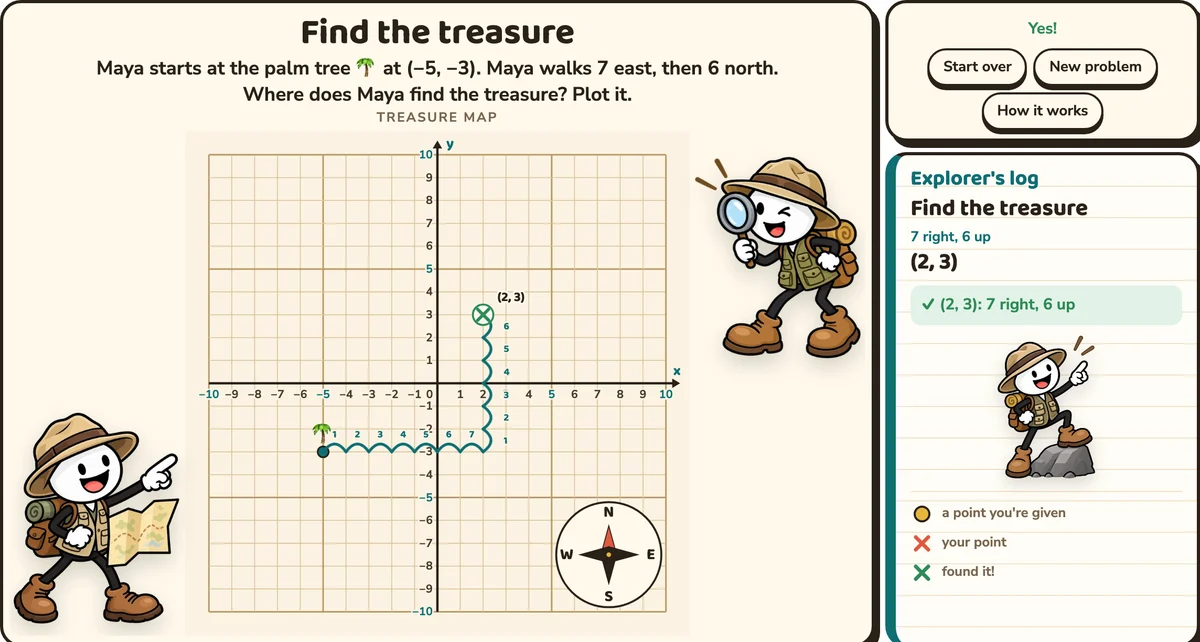
"Maya starts at the palm tree at (−5, −3). Maya walks 7 east, then 6 north. Where does Maya find the treasure?" A compass rose sits in the corner of the plane: north is up, south is down, east is right, west is left. Hops walk the route from the palm tree to the treasure at (2, 3).
Mystery pictures
Students mark the points in order, one at a time. Once a point is right, it joins the one before it, and the picture appears line by line. "Lift your pencil" starts a new line. The log ticks off each point.
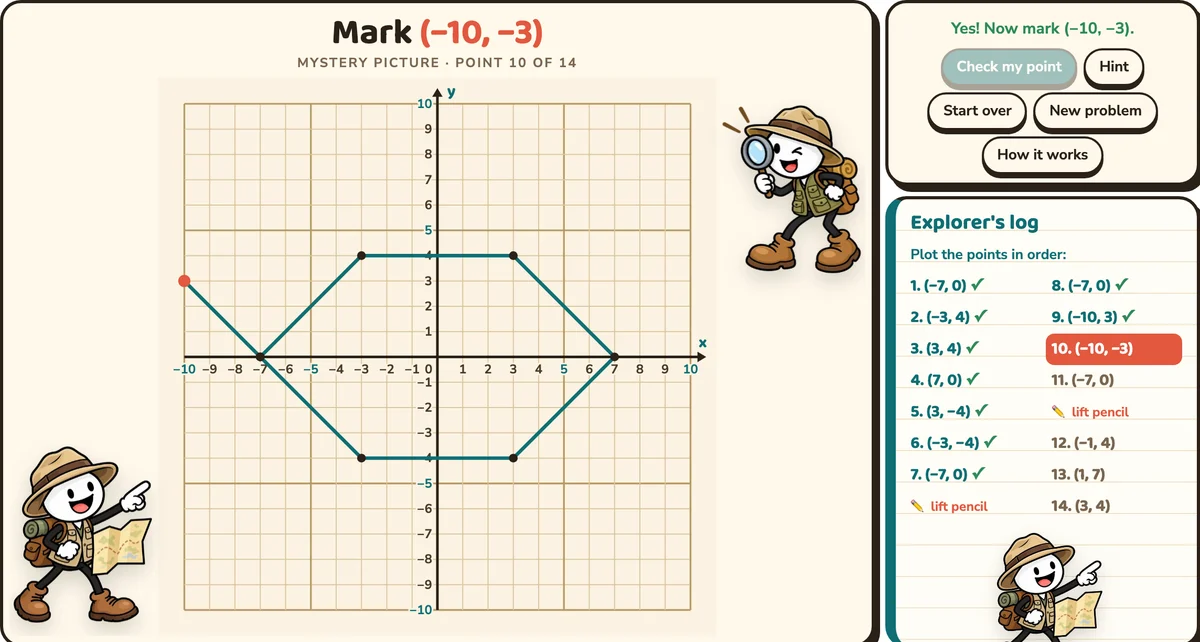
When every point is in, the picture is coloured in. There are five pictures: a pirate ship, a treasure chest, a parrot, a fish and a treasure island.
The explorer
An explorer in the Explorer's log changes with every step: reading the map at the start, looking through a magnifying glass at a hint, pointing from a rock at a right answer. On a computer, two more explorers stand beside the plane, and two more wave from either side of the title.
What students practise
- Plotting and naming ordered pairs in all four quadrants
- Using the signs of the coordinates to find the quadrant
- Reflecting points across the axes
- Finding distances between points with the same x or y
- Finding a missing corner and the area of a rectangle
- Solving word problems with directions on the plane
Teaching tips
- Model How it works on the class board before students try a level on their own.
- Say it out loud. "Across first, then up or down."
- Predict the quadrant from the signs before anyone plots.
- Across an axis, ask "How far is A from the axis? How far is B?"
- Guess the picture before the mystery picture is finished.
Standards
- 5.G.A.1: the coordinate system, plotting points in the first quadrant
- 6.NS.C.6b: signs of coordinates and quadrants; reflections across the axes
- 6.NS.C.6c: finding and positioning pairs of integers on a coordinate plane
- 6.NS.C.8: real-world problems in all four quadrants; distances between points with the same first or second coordinate
- 6.G.A.3: polygons from coordinates, and the lengths of their sides
Quick answers
What grades is it for? Grades 5–6. Grade 5 works in the first quadrant; the other levels are grade 6, and they're good review in grade 7.
Do students need accounts? No. It's a link, so there's nothing to sign in to.
What devices does it work on? Any device with a web browser, including Chromebooks, tablets, phones and the classroom board.
Can I turn the sound off? Yes, with the speaker button at the top. The tool remembers it.
Get Coordinate Plane Explorer
Give every point a path, and plotting starts to make sense.